
Response Time Monitoring for Every Client Site
See how fast each site really loads — measured on every check, shown in your dashboard and in the client's shareable report.
A site can be "up" and still be failing. Uptime says the site responded. It doesn't say it took eight seconds to do it. Pages don't crash all at once — they get slower, quietly, until visitors leave and conversions drop, and nobody connects the two.
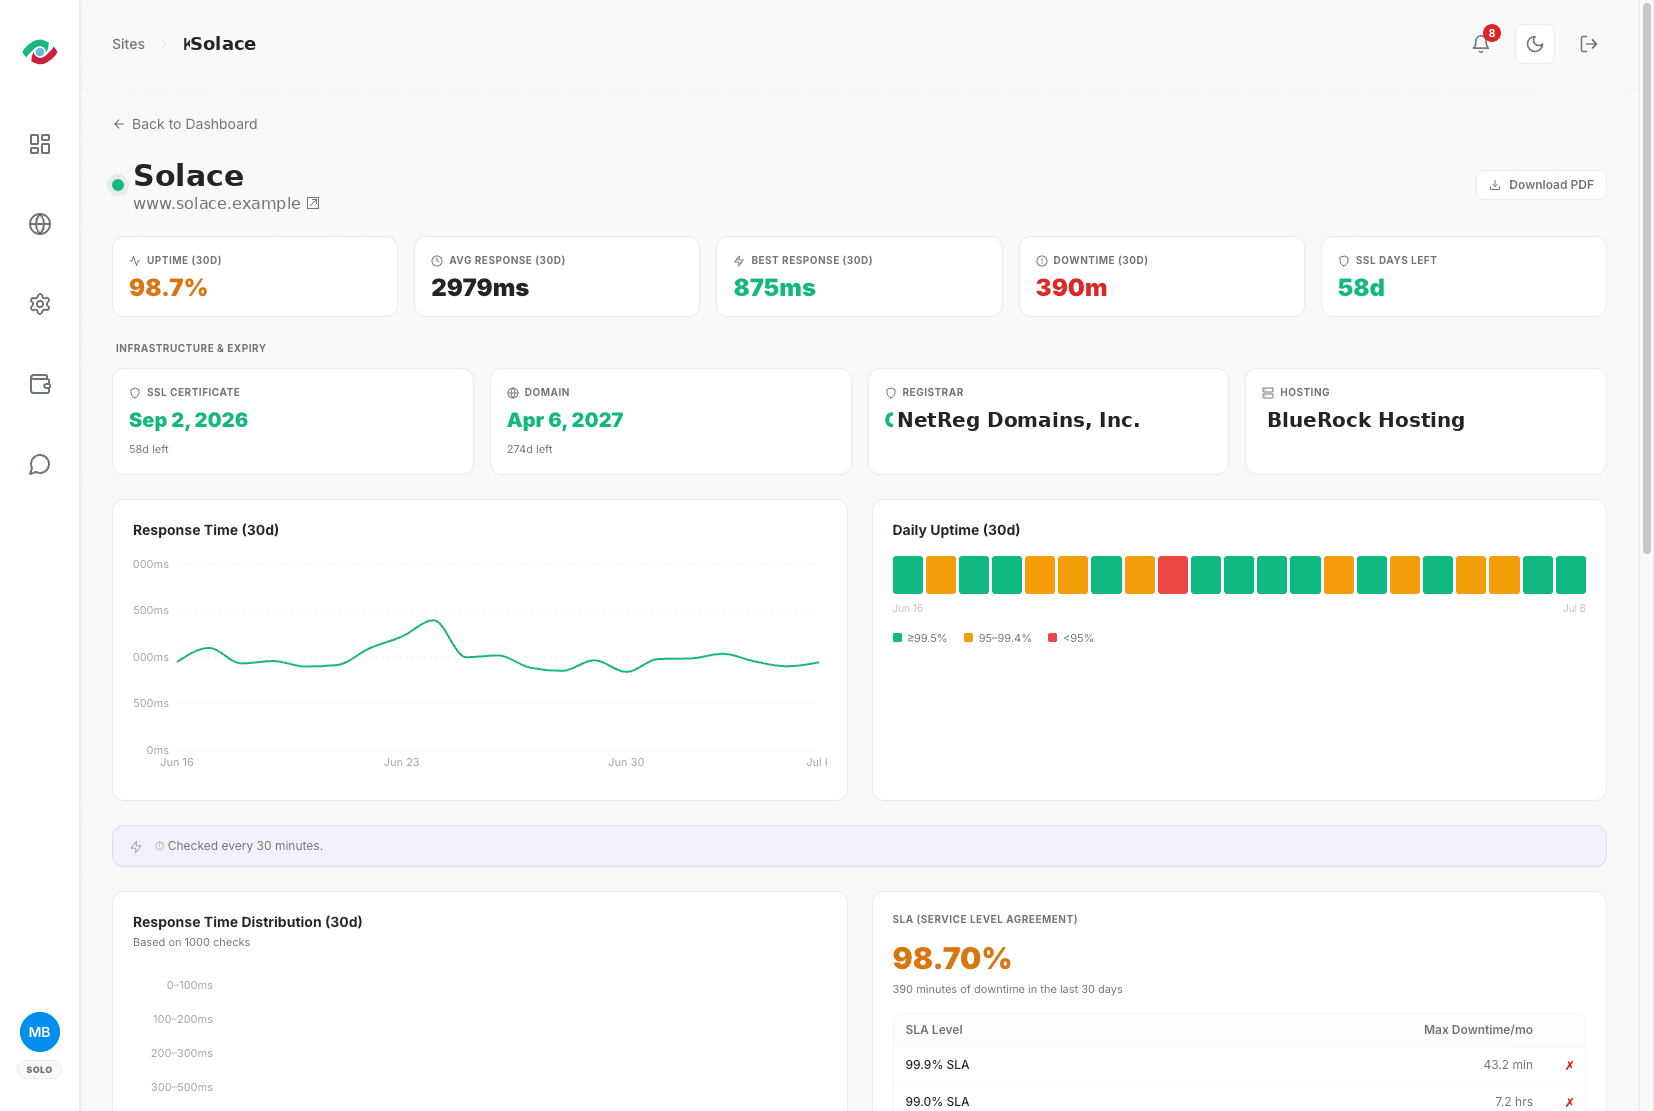
Response time tracked on every check, visible where it counts. Kikloper measures response time every time it checks a site and keeps the history. You see the trend in your dashboard, and the client sees it in their shareable report — so "it feels slow" becomes a number you can act on.
Why It Matters
Slow pages lose conversions
Every extra second of load time costs sales and sign-ups. A slow site fails at its job long before it ever goes down.
Response time creep is silent
Sites rarely slow down overnight. They drift — a plugin here, an unoptimized image there — until it's a problem. Tracking the trend catches the drift early.
It shows up in the client report
Response time is in the shareable report, so it's not just your metric — it's visible proof of performance the client can see.
Slowness is an early warning
A steady climb in response time often precedes an outage. Watching it lets you fix the cause before it becomes downtime.
Every check, timed and charted — so slow creep never hides.
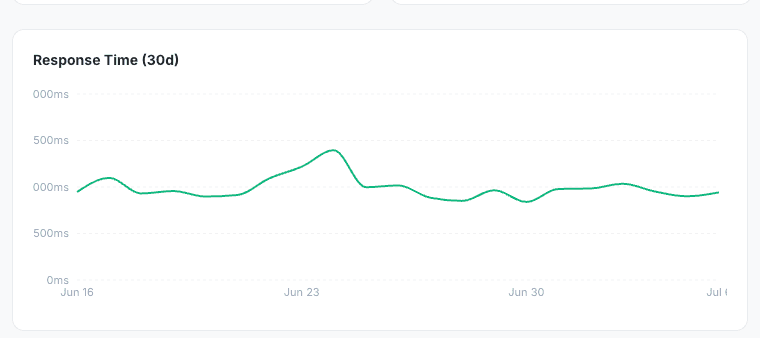
Every uptime check measures response time and adds it to your site’s performance history. Over time, trends become easy to spot, helping you identify gradual slowdowns before they affect availability.
- checkResponse time on every check
- checkRolling 24h performance view
- checkPer-site trend on the detail page
- checkResponse time included in weekly reports
How it works
We time every check
Each uptime check records exact response time, not just up/down.
We build a performance timeline
Every measurement is added to a rolling chart, making long-term performance trends easy to identify.
You catch it early
Spot gradual slowdowns before they turn into downtime or impact your visitors.
Related Features
Real-Time Uptime Monitoring
Know before your visitors — or your clients — do. Automatic checks on every site you manage, with instant alerts the moment one goes down.
Learn More arrow_forwardWeekly Performance Reports
A Monday morning summary of your whole portfolio.
Learn More arrow_forwardInstant Alerts, the Moment Something Breaks
Email and push notifications the second a site goes down, recovers, or a certificate is about to expire — so you act before your client notices.
Learn More arrow_forwardRelated Resources

Response Time Creep: The Slow Failure Nobody Notices in Time
Most developers are good at catching things that break. A site that returns a 500 error, a database that goes down, a deployment that breaks the build — these are visible, immediate, and easy to act on. What’s harder to catch is the site that doesn’t break. It just gets slower. Imperceptibly, week over week, […]
Read Articlearrow_forward
How to Share Live Website Reports with Clients Without a Login
At some point in most client relationships, the question comes up: “How’s the site doing?” It’s a reasonable question. The client is paying for a website that’s supposed to be working, and they want occasional confirmation that it is. The problem is how most freelancers answer it. The answer usually involves writing something — a […]
Read Articlearrow_forward
Client Report Pages vs. PDF Reports: Which Builds More Trust?
If you’ve ever sent a client a PDF report of their website’s uptime and performance, you already know the feeling. You export the data, format it, write a brief summary, attach it to an email, and hit send — knowing that the moment it arrives, it’s already out of date. That’s not a workflow problem. […]
Read Articlearrow_forwardFrequently Asked Questions
Website response time measures how long it takes for your server to respond to a monitoring request. Consistently increasing response times can indicate performance issues before downtime occurs.
Response time monitoring measures website performance, while uptime monitoring detects whether a website is reachable. Together, they provide a more complete picture of your website’s health.
Response time analytics are available on Solo and Pro plans, allowing you to review historical performance trends for every monitored website.
Kikloper records how long each monitoring check takes to get a response from the site, on every check, and stores the history.
It varies by site, but consistently under ~500ms is healthy; a steady climb matters more than any single number.
In your dashboard per site (including a trend view), and in the client's shareable report page.
Yes — it's part of the shareable report, so performance is visible proof alongside uptime.
Try the Full Kikloper Experience
Get full access to the Solo plan for 14 days. Monitor real websites, receive downtime alerts, track SSL certificates, and generate client-ready reports with no feature restrictions.