
Real-Time Uptime Monitoring
Know before your visitors — or your clients — do. Automatic checks on every site you manage, with instant alerts the moment one goes down.
Manually checking whether a website is online works for one or two sites—but not for dozens. By the time someone notices downtime, you’ve already lost visitors, leads, or a client call.
Kikloper checks every site automatically at your plan's interval — every 15 to 60 minutes depending on your plan. The moment a site goes down or recovers, it's on your dashboard and in your inbox, so you find out before your client does.
Why It Matters
You lose leads while you sleep
Downtime doesn't wait for business hours. A site down at 2am turns away visitors and sales until someone notices — hours or days without monitoring.
The client finds out first
Nothing damages trust faster than a client calling to say their site is down before you knew. Monitoring flips that: you reach out, already on it.
The portfolio problem
Checking two sites by hand is doable. Thirty isn't. The site you forget to check is the one that goes down. One dashboard watches all of them, continuously.
Downtime quietly hurts SEO
Search engines that repeatedly hit a down site crawl it less and, over time, may rank it lower. Catching outages fast protects long-term visibility.
Continuous uptime monitoring for every website you manage.
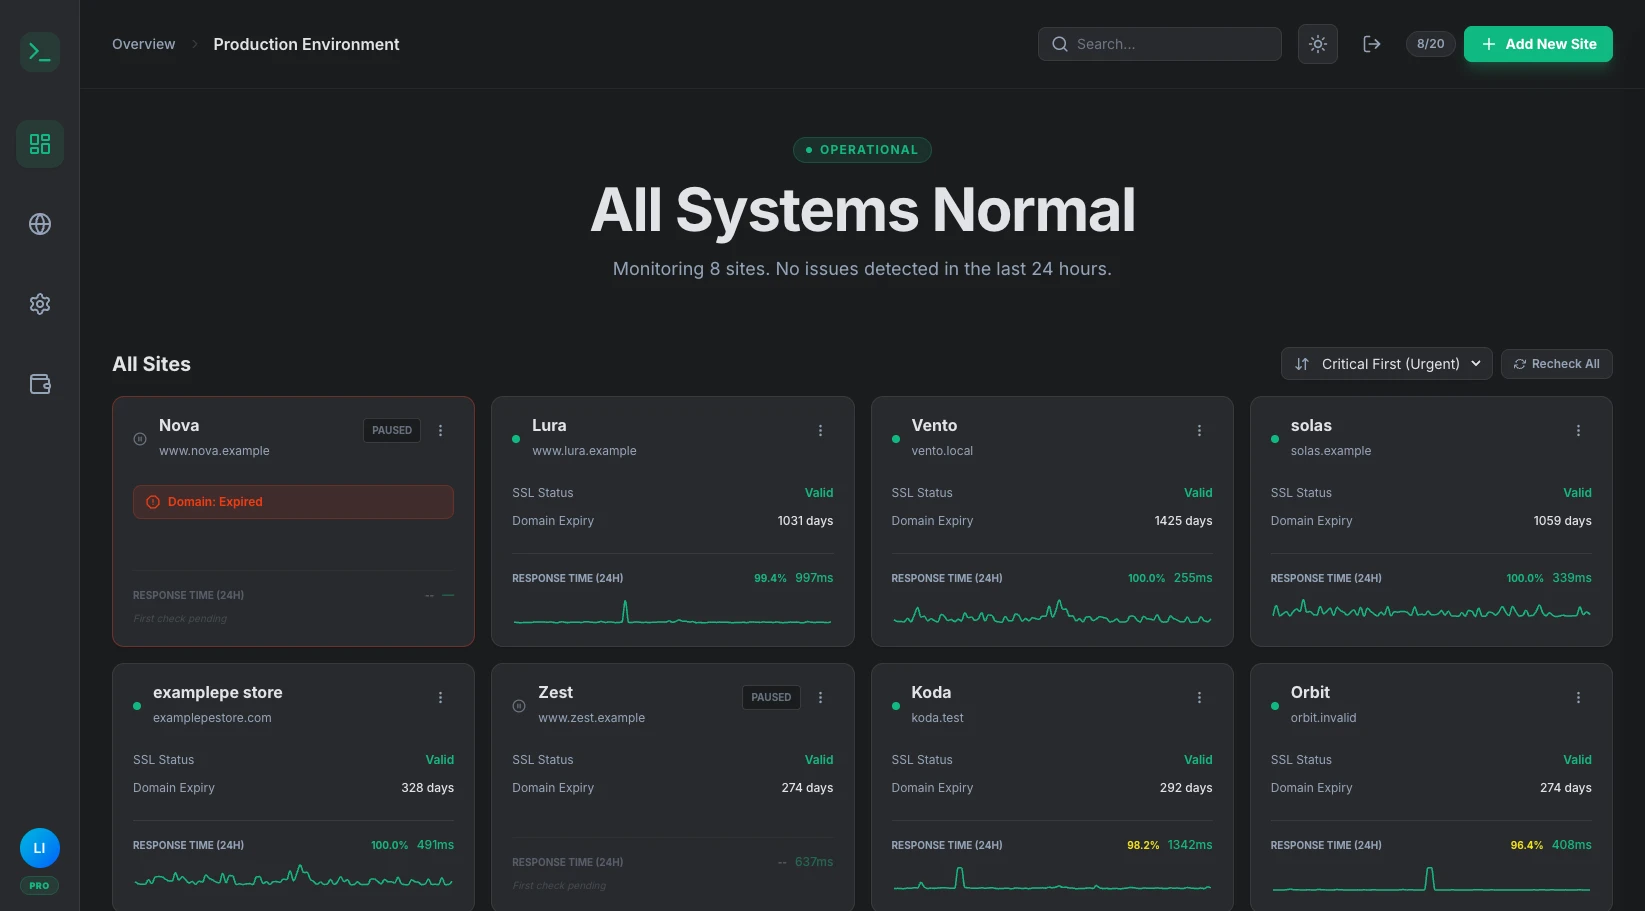
Each site is checked automatically at your plan's interval. The moment status changes — down or recovered — it's reflected on your dashboard and sent as an alert.
- checkPlan-based check interval
- checkResponse time tracking
- checkDown / Recovery detection
- checkFull incident history
How to Read Your Performance & Uptime Charts
Understand the colors, status indicators, and bar heights displayed across your Kikloper monitoring dashboard.
Reachable
Your site responded successfully with a healthy HTTP 200 OK status. All checks operational.
Unreachable
The server failed to respond, timed out, or returned a critical error code (500, 502, 503, 404). Instant alert sent.
Unknown
Check in progress, status indeterminate, or site monitoring paused manually by user.
Bar Height
The height of each vertical bar reflects response time (ms). Higher bars indicate latency; shorter bars mean faster loads.
How it works
Add your site
Paste a URL — Kikloper starts checking immediately.
We continuously monitor uptime
Every 15–60 minutes depending on your plan.
You get notified
Email and push alerts the moment status changes.
Related Features
Response Time Monitoring for Every Client Site
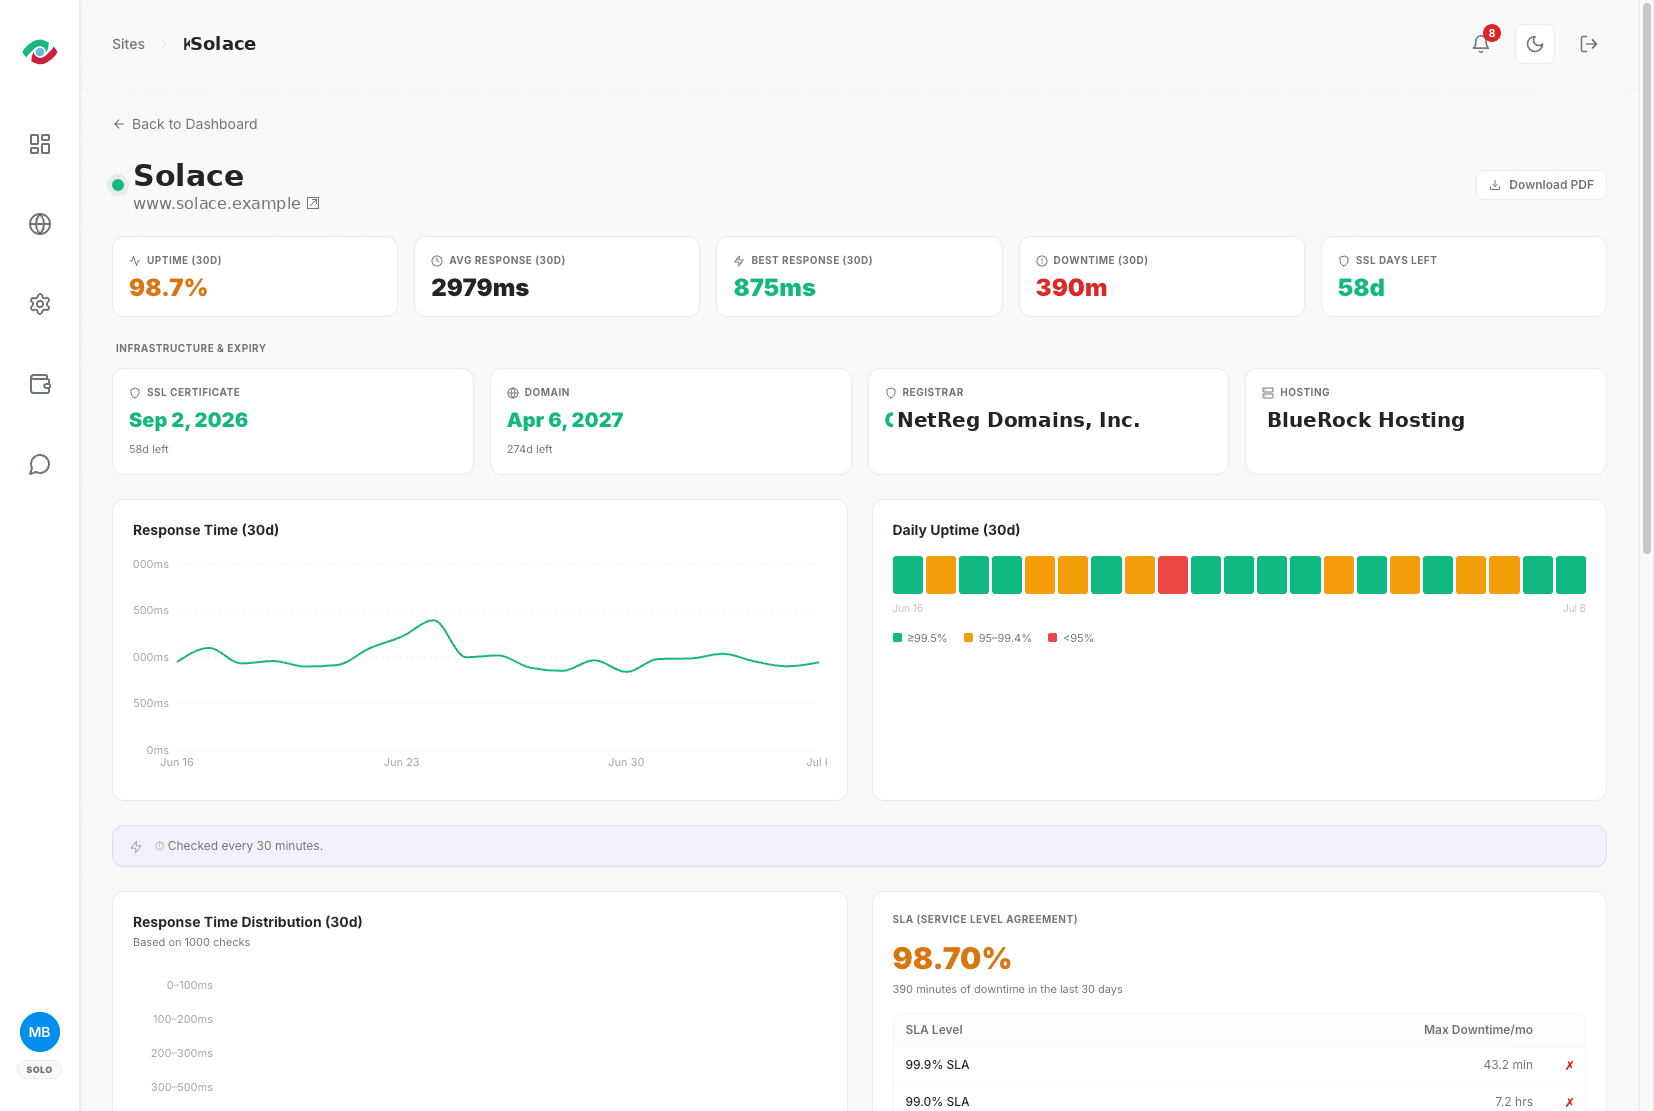
See how fast each site really loads — measured on every check, shown in your dashboard and in the client's shareable report.
Learn More arrow_forwardInstant Alerts, the Moment Something Breaks
Email and push notifications the second a site goes down, recovers, or a certificate is about to expire — so you act before your client notices.
Learn More arrow_forwardSSL Certificate Monitoring for Every Client Site
Catch an expiring certificate before it turns a client's site into a red browser warning. Automatic checks, alerts 30, 14, and 7 days out.
Learn More arrow_forwardRelated Resources

How to Monitor 10+ Client Sites Without Losing Your Mind
There’s a version of freelance success that creates its own problem. You’ve built a solid client base. Ten, twelve, fifteen clients on retainer. Each one has a website you’re responsible for. Each website has an SSL certificate, a domain registration, a hosting renewal date, and an uptime status that could change at any moment. All […]
Read Articlearrow_forward
How Agencies Use Uptime Alerts to Protect Campaign Performance
Digital marketing agencies are responsible for their clients’ budgets. When a campaign underperforms, the agency answers for it. When a landing page goes down mid-campaign and nobody notices for three hours, the agency answers for that too — even if the technical failure had nothing to do with their work. This is the reality of […]
Read Articlearrow_forward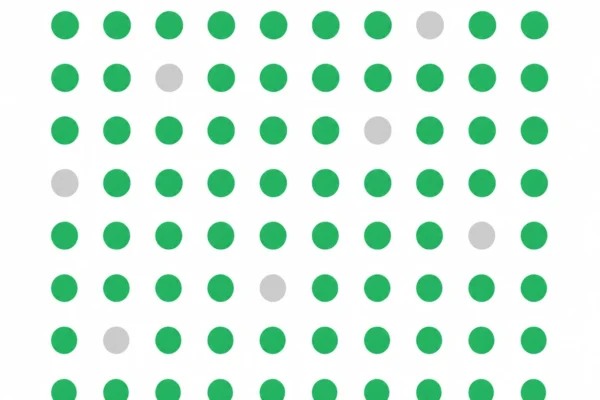
What 90 Days of Uptime Data Actually Proves to a Client
At some point in most freelance retainer relationships, a renewal conversation happens. Sometimes it’s scheduled — an annual review, a contract end date approaching. Sometimes it’s less formal: a client who’s been quietly wondering what they’re paying for decides to ask. In both situations, the freelancer’s job is the same: make the case for continued […]
Read Articlearrow_forwardFrequently Asked Questions
Kikloper detects server errors (500, 502, 503, 504), client errors (404, 403), connection timeouts, and DNS resolution failures.
Kikloper verifies non-200 HTTP response codes before triggering an official incident alert, preventing false alarms caused by temporary network glitches.
No, Kikloper uses ultra-lightweight HTTP HEAD/GET probes that consume negligible server resources and zero bandwidth.
Check frequency depends on your plan: every 60 minutes on Free, 30 minutes on Solo, and 15 minutes on Pro. Every check records uptime status and response time, so you get both availability and performance history.
99.9% uptime — the common industry benchmark — still allows about 43 minutes of downtime a month. Kikloper tracks your actual uptime percentage per site so you can hold hosting providers accountable and show clients real numbers.
As soon as a check detects a confirmed outage, Kikloper sends email and push alerts — within your plan's check interval. To avoid false alarms, an outage is verified before an alert is sent, so you're notified about real downtime, not a momentary network blip.
Try the Full Kikloper Experience
Get full access to the Solo plan for 14 days. Monitor real websites, receive downtime alerts, track SSL certificates, and generate client-ready reports with no feature restrictions.