

At some point in every client relationship, the question comes up.
“How has the site been performing?” Or: “Was there any downtime last month?” Or the one that stings a little: “Are you actually monitoring this?”
If you’re doing your job well — running uptime checks, tracking SSL certificates, watching for incidents — the honest answer is yes. But “yes” is invisible. It doesn’t build trust by itself. What builds trust is being able to show your work.
Most freelancers and developers handle this one of two ways. Some send a monthly email summary, which means manually pulling data, formatting it, and writing it up — work that takes an hour and feels disconnected from the actual monitoring. Others don’t report at all, and hope clients don’t ask.
There’s a third option. One that takes 30 seconds to set up and requires no email, no spreadsheet, and no recurring manual effort: a shareable client report page.
Here’s how it works — and why it changes the way clients perceive the service you’re delivering.
Why Client Reporting Matters More Than Most Freelancers Think
Website management is largely invisible work. Your client doesn’t see you catching a downtime alert at 7am, renewing an SSL certificate before it causes a browser warning, or noticing that response times have been creeping up. They just see their website — and when it works, they don’t think about it.
That’s the trap. When everything is running smoothly, clients can start to wonder what they’re actually paying for. Retainers get questioned. Contracts get reviewed. And when a cheaper alternative comes along, there’s no concrete evidence of the value you’ve been delivering.
A professional uptime report solves this problem directly. It makes the invisible visible — turning background monitoring work into something your client can see, reference, and share internally if needed. It also signals something important: that you take their website seriously enough to track it, document it, and keep them informed.
The question is how to do this without creating more work for yourself.
What a Good Client Report Actually Contains
Before getting into the mechanics, it’s worth being clear about what belongs in a client-facing report — and what doesn’t.
Clients don’t need to understand your monitoring infrastructure. They don’t need raw server logs, technical error codes, or configuration details. What they need is a clear, human-readable summary of one thing: is their website healthy, and how has it been performing?
A good client report includes:
Uptime percentage. The single most important number. “Your site was online 99.8% of the time over the last 90 days” is immediately meaningful to a non-technical client. It’s concrete proof of reliability.
Response time data. How quickly is the site loading? A response time chart over time shows both the current performance and any patterns — spikes, degradation, improvements after changes you made.
SSL certificate status. Valid or not, and when it expires. This one line can prevent a client from ever panicking about a security warning, because they can see for themselves that it’s being tracked.
Incident log. Any downtime events, with timestamps. If there was an incident, a professional report shows when it started, when it was resolved, and how long it lasted. Transparency here builds trust — clients appreciate knowing about issues, as long as they also see they were handled.
What you leave out: anything that requires technical knowledge to interpret, anything that creates follow-up questions, and anything that makes the report feel like a data dump rather than a summary.
The Manual Reporting Problem
Most freelancers who do report to clients do it manually. They log into their monitoring tool, screenshot a few graphs, paste uptime numbers into an email, write a brief summary, and send it. Every month. For every client.
Multiply that by 10 clients and it’s easily a few hours of recurring work per month — work that isn’t billable, isn’t scalable, and still doesn’t give clients a live view of their site’s status between reports.
There’s also the inconsistency problem. A monthly email feels professional when you send it promptly on the first of every month. It feels less professional when it’s the 14th and you haven’t sent it yet because you’ve been heads-down on a project. Manual processes depend on discipline, and discipline has bad weeks.
The alternative is automation: a live report page that’s always up to date, always accurate, and always accessible — with no effort required from you after the initial setup.
How Kikloper’s Client Report Pages Work
Kikloper includes shareable client report pages on the Solo and Pro plans. Here’s exactly how the workflow looks from setup to delivery.
Step 1: Add your client’s website to Kikloper.
Log into your Kikloper dashboard and add the client’s URL as a monitored website. Kikloper immediately begins checking uptime, measuring response times, and tracking the SSL certificate. This takes about two minutes.
Step 2: Enable the client report page.
Inside the website’s settings in Kikloper, enable the public report page. Kikloper generates a unique URL — something like app.kikloper.com/report/[unique-id]. This page is publicly accessible but not indexed or searchable — only people with the link can view it.
Step 3: Share the link with your client.
Send the URL to your client once — in your welcome email, in your monthly retainer invoice, or in a simple message: “Here’s a live page where you can always check your site’s status.”
That’s it. You never need to send another report email. The page updates automatically as Kikloper continues monitoring.
What your client sees when they open the link:
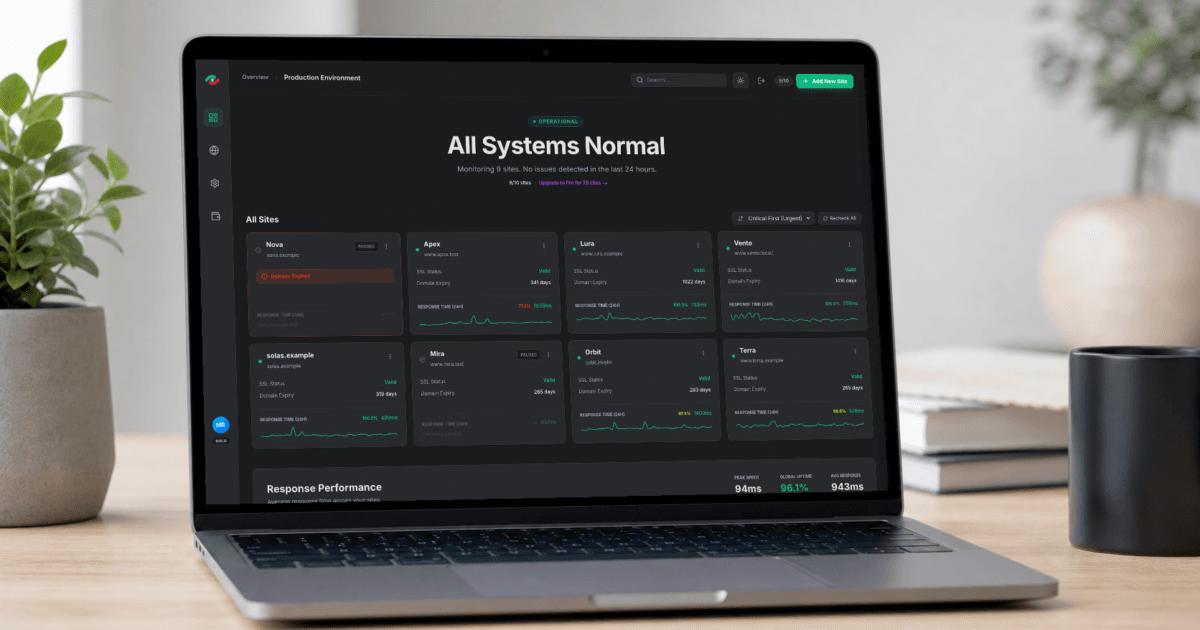
A clean, professional page showing the site’s uptime percentage for the last 30, 60, and 90 days. A response time chart. The SSL certificate status and expiry date. An incident log with timestamps for any downtime events. No login required, no technical jargon, no Kikloper branding getting in the way of your work.
Step 4 (Pro plan): Add your own branding.
On the Pro plan, report pages support white-labelling. You can present the report under your own brand rather than Kikloper’s — useful if you want the reporting experience to feel like part of your own service offering rather than a third-party tool.
What This Looks Like in Practice
Imagine a client who manages a small e-commerce store. They’re not technical, but they care about reliability — their livelihood depends on the site being up and running.
Instead of waiting for a monthly email from you, they have a bookmark. Any time they want to check in — after a server migration, before a big sale, just out of curiosity — they open the link and see the current status. Green uptime indicator. SSL valid for another 47 days. No incidents in the last 30 days. Response time averaging 380ms.
They close the tab reassured. They don’t email you. They don’t wonder if you’re doing your job.
Now multiply that across every client you manage. The reporting question — are you actually monitoring this? — stops coming up, because clients can see the answer themselves, any time they want.
The Compound Effect on Client Relationships
There’s a longer-term benefit to this kind of transparency that’s easy to underestimate.
Clients who have visibility into their website’s performance are more likely to stay on retainer. They have a tangible, always-visible reminder of the service they’re receiving. When renewal time comes around, they’re not deciding based on memory — they can look at 90 days of uptime data and incident history. The value is documented.
For freelancers and developers who compete on quality rather than price, this is a meaningful differentiator. Most of the competition doesn’t offer this. A shareable report page is a small feature with a large impression.
Stop Sending Monthly Emails. Start Sharing a Link.
Kikloper’s client report pages are included on the Solo plan — $5/month for up to 10 monitored websites. The Pro plan adds white-label reports for $10/month.
Setup takes under five minutes. Once it’s done, your reporting is fully automated — live, accurate, and always available to your clients without any ongoing effort from you.
There’s a 14-day free trial with full Solo plan access and no credit card required.
Ready to make your monitoring work visible?
Start your free 14-day trial at Kikloper — add your first client site, generate a report page, and send your client a link today.


