

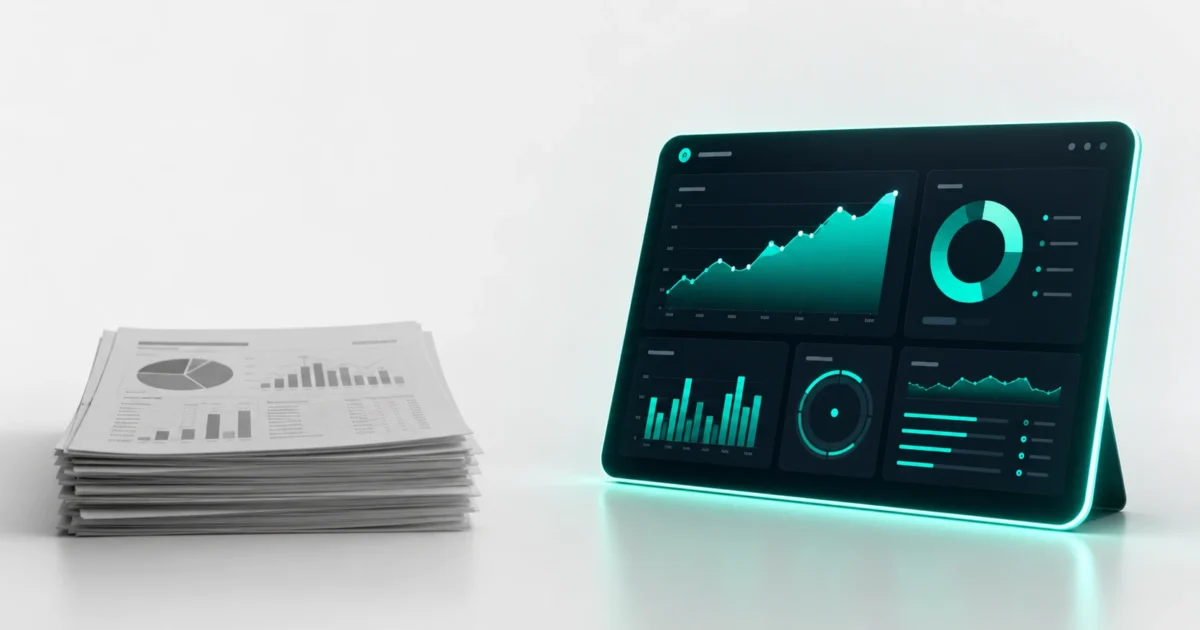
If you’ve ever sent a client a PDF report of their website’s uptime and performance, you already know the feeling. You export the data, format it, write a brief summary, attach it to an email, and hit send — knowing that the moment it arrives, it’s already out of date.
That’s not a workflow problem. That’s a fundamental mismatch between the format and the job it’s trying to do.
Website performance is live data. It changes every hour. A PDF is a static document. Sending a static document to communicate live information is like printing off today’s weather forecast and asking someone to refer to it next month.
The comparison worth making isn’t PDF versus no reporting. It’s PDF versus a live report page — and the differences go well beyond convenience.
What a PDF Report Actually Communicates
A PDF report communicates effort. Someone compiled this, formatted it, and sent it to you. That has value — it signals that the freelancer or developer is paying attention and considers reporting part of their job.
What a PDF doesn’t communicate is currency. The moment a client reads it, the data is historical. The uptime percentage from last month says nothing about whether the site is up right now. The SSL status from two weeks ago says nothing about whether the certificate expires tomorrow. The performance data from the last reporting period says nothing about what’s happening today.
For most clients, this is fine most of the time. They’re not monitoring their own website obsessively. But there are specific moments when currency matters enormously: right before a product launch, during a marketing campaign, when a stakeholder asks an unexpected question in a meeting. In all of these situations, a client with a PDF has to either trust that the old data still applies, or contact you to ask for an update.
A client with a live report link has an answer in thirty seconds.
What a Live Report Page Actually Communicates
A live report page communicates something different from a PDF. It doesn’t just show data — it demonstrates an ongoing system.
When a client opens a live report link, they’re not looking at a summary of what happened. They’re looking at what’s happening — current uptime status, response times from today, SSL certificate expiry with a countdown, a live incident log. The page is always current because it’s always connected to real monitoring data.
This shifts the relationship dynamic in a subtle but important way. The PDF implies: I checked, here’s what I found. The live page implies: this is being watched continuously, and you can see it any time you want.
The first is reassuring. The second is demonstrable proof.
Clients who have access to a live report page also tend to ask fewer questions — not because they’re less engaged, but because they can already see the answers. The background anxiety that generates “just checking in” emails goes quiet when the data is always available.
The Trust Gap
Trust in a client relationship is built on two things: competence and transparency. A PDF report addresses competence — it shows you’re monitoring and you care enough to report. But it doesn’t address transparency well, because the client has no way to verify the data independently or access it outside the reporting cycle.
A live report page addresses both. Competence is demonstrated by the monitoring data itself — uptime percentages, incident logs, response time trends. Transparency is demonstrated by making that data continuously accessible, without the client needing to request it.
There’s also a renewal conversation dimension here. When a retainer comes up for review, a client with only PDF reports has to make a decision based on memory and accumulated emails. A client with a live report page has the entire service history in one place — 90 days of uptime data, zero critical incidents, SSL always valid. That’s not a memory. That’s evidence.
Evidence tends to renew retainers. Memory tends to invite renegotiation.
The Practical Comparison
On the workflow side, the difference is even starker.
A PDF report requires time to produce — pulling data, formatting it, writing the summary, attaching and sending. For one client, this might be twenty minutes. For ten clients, it’s several hours of non-billable work every month, forever.
A live report page requires about five minutes to set up once. After that, it requires nothing. The page updates automatically as monitoring continues. You never touch it again unless the client asks a question the page can’t answer — which is rare.
The time savings alone justify the format switch. But the trust benefit is the more important part, because it compounds over time. Every month a client has had access to a live report page is another month of demonstrated reliability — quietly building the case for renewal before the conversation even starts.
When PDFs Still Make Sense
There are situations where a PDF has a role: formal quarterly reviews, compliance documentation, deliverables that need to be archived or signed. If a client’s internal processes require a document they can file, a PDF is the right format for that.
But a PDF for the recurring “how’s the site doing” purpose? That’s the wrong tool. The job requires live data, and a live format.
Making the Switch
Kikloper includes shareable client report pages on every plan. Each monitored website gets a unique public URL showing live uptime history across multiple timeframes, SSL certificate status with expiry countdown, response time data, and a full incident log.
No login required for the client. No monthly work required from you. One link, shared once, that does the job of every status email and PDF report you’d otherwise write.
The Solo plan covers 10 client sites at $5/month. The Pro plan adds white-label reporting for $10/month — your brand, your domain, no Kikloper branding in sight. Both plans include a 14-day free trial with no credit card required.
A document is a snapshot. A link is a living record. Start your free trial at Kikloper and replace your PDF reports with something that’s always current.


